The tooling is not the problem
It is worth being clear about this. Shopify's analytics are good. The default customer reports alone include new customers over time, new versus returning, one-time customers, cohort analysis, RFM segmentation and a predicted spend tier. Reports can use store-specific data including metafields. Every default report exposes the ShopifyQL query behind it, so you can read how the number was produced rather than trusting it.
If your orders are in Shopify, most of what follows is unnecessary. Use the reports. They are faster than anything you would build, they are free, and somebody else maintains them.
The gap this article is about does not open because the tooling is weak. It opens because of where the orders are.
Reporting on the orders you happen to have
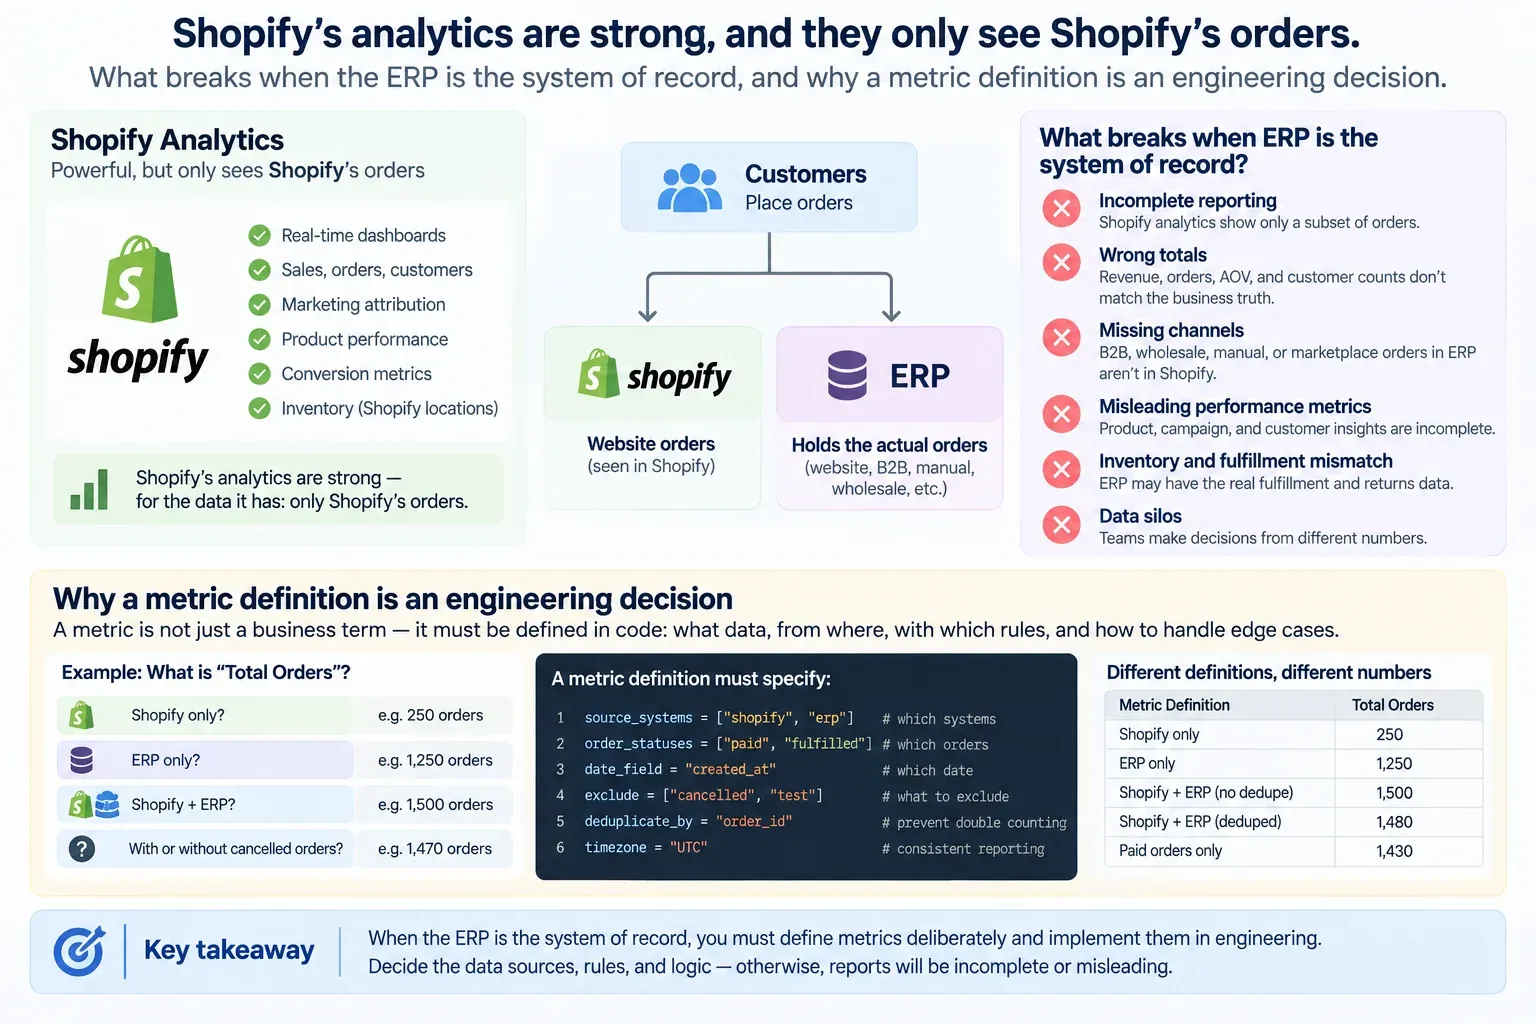
Shopify Analytics reports on orders that exist in Shopify. That is not a flaw; it is what the product is for. It becomes a problem only in a specific situation: a business whose system of record is an ERP, taking orders through channels that never touch the storefront — a rep with a laptop, a phoned-in reorder, an EDI feed, a sales office. Those orders are real revenue from real customers, and Shopify has never heard of them.
The result is not an error message. It is a smaller number, presented with exactly the same confidence as a complete one. Revenue looks lower, which people notice and query. Customer counts look different in a way nobody queries, because there is no intuition for what the right figure should be. And the ratios — new versus returning, average order value, revenue concentration — are computed over whichever slice happened to arrive, which makes them wrong in a direction nobody can predict.
Before any of this is worth building, the sync underneath it has to be complete, and that is a separate problem with its own failure modes. A report built on a partial sync is the same trap one layer down.
A definition is a decision
The second gap is subtler and it survives even when all the orders are in one place.
Shopify defines a returning customer precisely: someone who placed an order and whose order history already includes at least one order. That is a clear, defensible definition, and it is binary. There is no third state. A customer who bought twice in 2023, disappeared for two years and came back last month is, by that definition, returning — indistinguishable from someone who buys every six weeks.
For a wholesale business those are not the same customer and the difference is the whole point of asking. One is retention. The other is a win-back that somebody should probably follow up.
The same thing happens on the product side. Bestseller is not a fact, it is a choice between several. Ranked by revenue you learn which products carry the turnover. Ranked by units you learn what moves. For Weldaad the useful ranking was units sold divided by minimum order quantity, which approximates how often a product is reordered rather than how much of it leaves the building — a different question, and the one the buying team actually had. No platform ships that metric, because it is not a platform metric. It is a sentence about how this business works, written as arithmetic.
This is where the work is. Not in fetching the numbers, which is routine, but in deciding what each one means and then defending that definition when the figure it produces is unwelcome.
History is not inside the reporting period
There is a specific trap in period-based reporting, and it is easy to walk into because the code looks correct.
To classify a customer's behaviour in Q2, you need their orders from before Q2. The classification is a statement about a relationship, and a relationship has a length. Fetch only the period's orders — which is the efficient, obvious query — and every customer in the result has exactly one visible order, which makes them all new.
That is what happened to the first version of this dashboard. It read the active order backlog, which is what the portal already had cached, and it was not wrong about anything it could see. Adding historical delivered orders from the ERP was not an enhancement; it was the difference between a report and a guess.
const DAY_MS = 86_400_000;

/**
 * new         — no order before the period started
 * returning   — ordered before, and recently enough to still count as active
 * reactivated — ordered before, then went quiet for longer than `lapseDays`
 * null        — did not order in the period at all, so has no state in it
 */
export function classifyCustomer({ orderDates, periodStart, periodEnd, lapseDays = 365 }) {
  if (!Array.isArray(orderDates)) throw new Error("orderDates must be an array");
  if (!Number.isFinite(lapseDays) || lapseDays <= 0) {
    throw new Error(`lapseDays must be a positive number, got ${lapseDays}`);
  }

  const start = Date.parse(periodStart);
  const end = Date.parse(periodEnd);
  if (Number.isNaN(start) || Number.isNaN(end)) throw new Error("period bounds must be parseable");
  if (end < start) throw new Error("periodEnd is before periodStart");

  const times = orderDates.map((d) => {
    const t = Date.parse(d);
    if (Number.isNaN(t)) throw new Error(`unparseable order date: ${d}`);
    return t;
  });

  const inPeriod = times.filter((t) => t >= start && t <= end);
  if (inPeriod.length === 0) return null;

  // Strictly before the window. Orders after it are the future as far as this
  // report is concerned and must not make a first-time buyer look like a returning one.
  const before = times.filter((t) => t < start);
  if (before.length === 0) return "new";

  const lastBefore = Math.max(...before);
  const firstInPeriod = Math.min(...inPeriod);

  return firstInPeriod - lastBefore > lapseDays * DAY_MS ? "reactivated" : "returning";
}
The lapse window is a business rule
The lapse window is a parameter rather than a constant on purpose. Ninety days is right for consumables and absurd for machinery, and the merchant is the only person who can say which they sell.
What this does not fix
It does not make the underlying data true. A dashboard computed from a stale or partial sync produces confident nonsense faster than the spreadsheet it replaced, and the more polished it looks the longer it takes anyone to doubt it.
It does not replace accounting. Revenue in an operational dashboard and revenue in the finance system will disagree — credit notes, returns, cut-off dates, currency — and the dashboard should never be the number that reaches a tax return. Say which is authoritative, in writing, before anyone asks.
And it does not settle the definitions. It records the ones you chose. A bestseller ranked by units divided by minimum order quantity is a decision somebody can disagree with, and they should be able to see it and argue rather than discovering the formula six months later.
When this needs an engineer
Often it does not. If your orders are in Shopify, the built-in reports answer most of this, and building a parallel reporting layer is a way of acquiring a maintenance burden in exchange for a worse version of something you already have. If the question is how did last month go, a CSV export and half an hour usually beats a dashboard nobody has agreed the definitions for.
It needs engineering when the orders are split across systems so no single tool sees all of them, when the questions are specific enough that no default report expresses them, and when the answers will be used to make buying and stocking decisions rather than to feel informed. That was the case for a wholesale business already running four Exact Online integrations, where the management dashboard turned years of ERP sales history into something the team could ask questions of. It is Shopify ERP and CRM integration work rather than a reporting exercise, because the hard part is agreeing what the numbers mean and then keeping them honest.
Send us the store and the symptom.